

Project Overview
This project demonstrates how event data from multiple platforms—Microsoft Outlook, a CRM system, and Microsoft Forms—can be unified into a single Power BI dashboard to provide a complete view of organizational events.
Instead of switching between multiple applications to track meetings and events, I built an automated solution that consolidates data from all sources into one place. This not only provides a comprehensive scheduling overview but also simplifies maintenance and keeps the dashboard synchronized with changes across systems.
The Business Problem
The client managed meeting schedules across three different platforms. Constantly switching between Outlook, the CRM, and Microsoft Forms to view events was time-consuming and inefficient. Since these platforms were not synchronized, overlapping meetings and scheduling conflicts could occur, making it difficult to maintain an accurate organizational calendar.
Project Objectives
The primary objective was to consolidate event data from all sources into a single, reliable calendar that provides a complete picture of the organization’s schedule.
The solution needed to be:
- Automated, with minimal manual maintenance.
- Dynamic, reflecting updates from each source.
- Responsive, so event creations, updates, and deletions are synchronized automatically.
Data Collection & Preparation
The first step was collecting Outlook calendar events into a SharePoint List using Power Automate. I created two separate flows: one to handle event creation and deletion, and another to process event updates. This ensured that changes made in Outlook were automatically reflected in the dashboard.
CRM events were imported into Power BI through the system’s REST API, while manually created events submitted through Microsoft Forms were stored in a separate SharePoint List and connected to Power BI as an additional data source.
After collecting data from all sources, I normalized the datasets so that field names, formats, and values were consistent across the entire model. Since event timestamps were stored as DateTime, I separated them into dedicated Event Date and Event Time fields for easier modeling and visualization.
Finally, I created a centralized _factEvents table containing all events and built the supporting dimension tables, resulting in a clean star schema optimized for reporting.
Dashboard Design
The design requirement was to create a minimal, clean, and classic user interface. I initially designed a more traditional calendar-style layout, but that approach was ultimately not approved by the client.
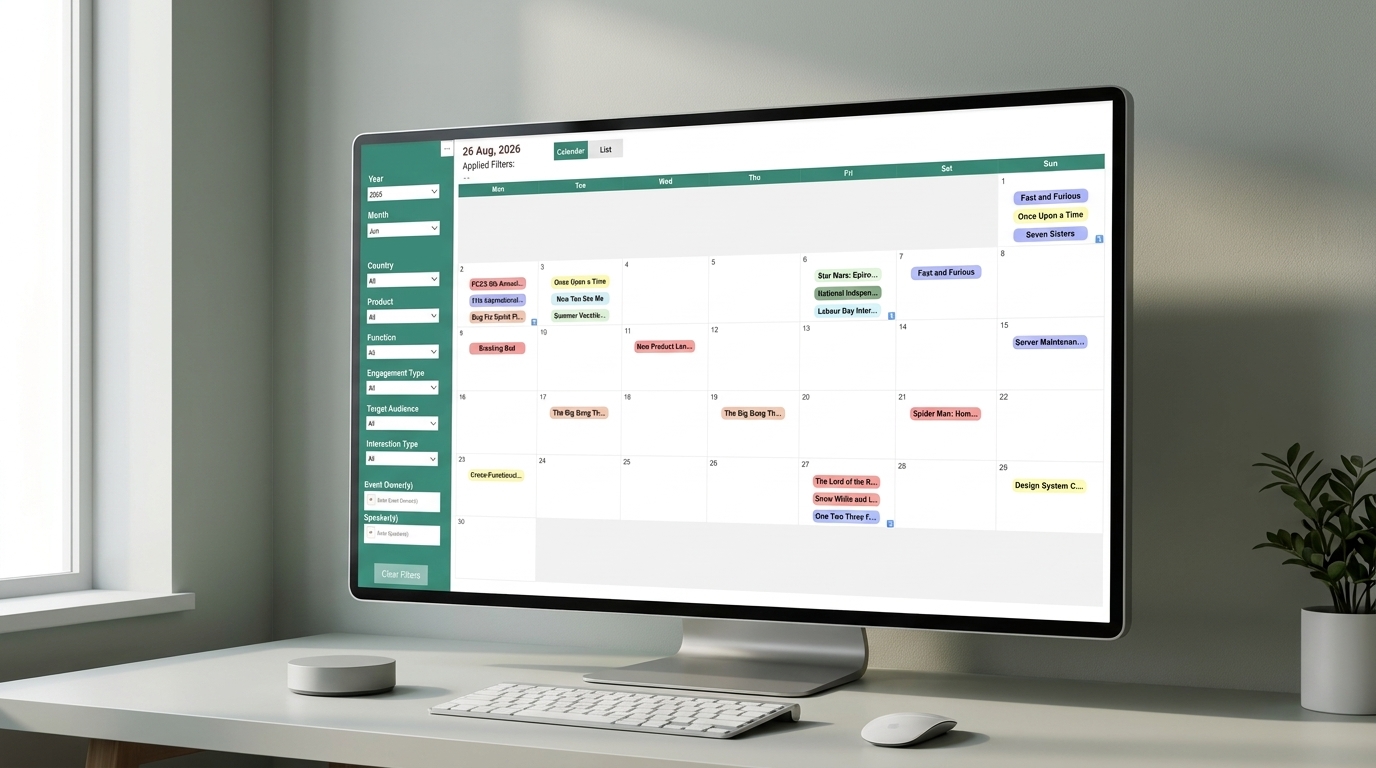
One of the biggest challenges was building a calendar visualization in Power BI. There is no native calendar visual that met the project’s requirements, and I was not allowed to use paid or uncertified custom visuals. Instead, I built the calendar entirely using Deneb with Vega.
The visual went through several iterations. I started by rendering the calendar structure with Vega, displaying dates in a monthly grid. I then incorporated public holidays to complete the calendar layout.
The final step was visualizing events using group marks. To make the calendar interactive and capable of displaying multiple events within each day, I implemented Vega signals and event handling logic, allowing the visual to respond dynamically to user interactions.
Outcome
The final solution is an interactive calendar dashboard that provides a unified view of all organizational events, regardless of their source. Users can view events in a calendar layout while also accessing a detailed list view through a Power BI table visual.
The dashboard automatically stays synchronized with Outlook, CRM, and Microsoft Forms, reducing manual effort and providing stakeholders with a single source of truth for scheduling.
What I Learned
This project significantly expanded my knowledge of Vega and Deneb. To achieve the required functionality, I learned advanced Vega concepts such as signal management, event handling, and interactive group marks.
I also gained experience working with a third-party CRM API. Understanding the documentation, identifying the correct endpoints, and implementing the integration into Power BI was a challenging but rewarding part of the project.
Overall, this project strengthened both my Power BI development skills and my ability to integrate, model, and visualize data from multiple enterprise systems.