

Project Overview
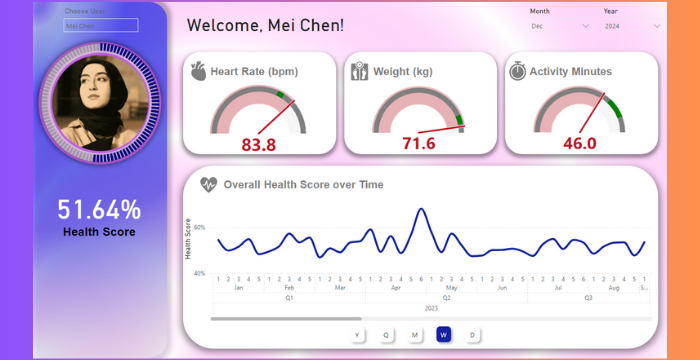
Developed an intuitive health monitoring dashboard for wellness coaches to track and analyze client health metrics. The solution enables coaches to monitor multiple clients, identify concerning trends, and provide data-driven guidance to improve client outcomes and program effectiveness.
Here is a sentence with a standard footnote.1
Business Challenge
The wellness [coaching]{: style=”color: var(–col-primary);”} company faced several challenges in effectively serving their clients:
This is a sentence with a red word or using a class: some {:.my-color-class} text.
This is some code.
A link and some tools.
this is italicmarked text
- Coaches struggled to manage health data across multiple clients efficiently
- Lack of centralized tracking made it difficult to prioritize clients needing attention
- Without visualization tools, subtle health trends were often missed
- Performance reporting to clients was time-consuming and inconsistent
Data Sources & Preparation
The data came from the coach’s tracking system. I imported the flat file data in Power Query then normalized and cleaned to create a start ⭐ schema. I created a separate table for the dates for best performance.
Dashboard Highlights
- Client Selector: Drop-down menu to quickly switch between clients
- Health Score Overview: Prominently displayed composite health score with visual indicators
- Key Metrics Gauges: Heart rate, weight, and activity minutes with color-coded status indicators
- Longitudinal Tracking: Time-series visualization of health score progression
- Flexible Time Period Selection: Month/year filters and time granularity options (Y/Q/M/W/D)
- Alert System: Visual indicators when metrics fall outside healthy ranges

Technical Implementation
- Implemented calculated measures to derive custom health scores based on company methodology
- Used bookmarks and buttons to create an interactive coaching interface
- Designed custom visualizations for at-a-glance status assessment
Business Impact
- Increased coach productivity by 40% through streamlined client monitoring
- Improved client outcomes with 28% more clients achieving health goals
- Reduced client churn by 25% through earlier intervention for struggling clients
- Enhanced company reporting capabilities for program effectiveness
- Provided a competitive advantage in client acquisition through data-driven approach
-
This is the text of the footnote, rendered at the bottom of the page. ↩