

Deneb & Vega - 02: Code Editors for Vega
28 Jun 2025
Introduction
We learned in the previous post that Vega is a declarative language where we can create visualizations by declaring the components of the visuals using JSON.
In this post, we will learn about some of the features of the code editors for Vega. If you want to create a standalone visualization using Vega, you can use the online editor. If you are using Vega inside Power BI, Deneb provides a code editor for that.
Understanding how to navigate and use these editors will save you a lot of time later when your visuals get more complex or interactive. So, before diving into coding, let’s get comfortable with the tools we’ll be using.
Online Editor
The online editor for Vega and Vega-Lite is the easiest way to try and test any Vega or Vega-Lite code. You don’t have to download anything—you can use it in any browser. The online editor looks like the following picture:

It has three panes: the left pane is for writing the code, the top right pane is where the visuals are rendered, and the bottom right pane shows the raw data, parameters, and logs. The code pane and the visual pane are self-explanatory, but the data pane is extremely important to understand how Vega or Vega-Lite works.
The data pane has four tabs: LOGS, DATA VIEWER, SIGNAL VIEWER, and DATAFLOW VIEWER. We can see the error messages in the LOGS tab. The DATA VIEWER shows the datasets used in making the visuals. The SIGNAL VIEWER shows all the signals (signals are variables and parameters used to produce the visuals—we will learn about signals later). And the DATAFLOW VIEWER shows a graphical representation of the connections among all the elements.
This pane helps us understand how Vega is processing your data and transforming it step by step. When our chart doesn’t behave as expected, this is the place to look.
In this series of posts, I will give a lot of examples to help you learn better. You can see the code for a particular chart by clicking on the three dots in the top right corner and selecting ‘Open in Vega Editor’. It will open the online editor in a new tab with the code to create the visual. Similarly, you can select ‘View Source’ to see the JSON code only.
This feature makes it very convenient to learn from others’ charts or to debug your own.
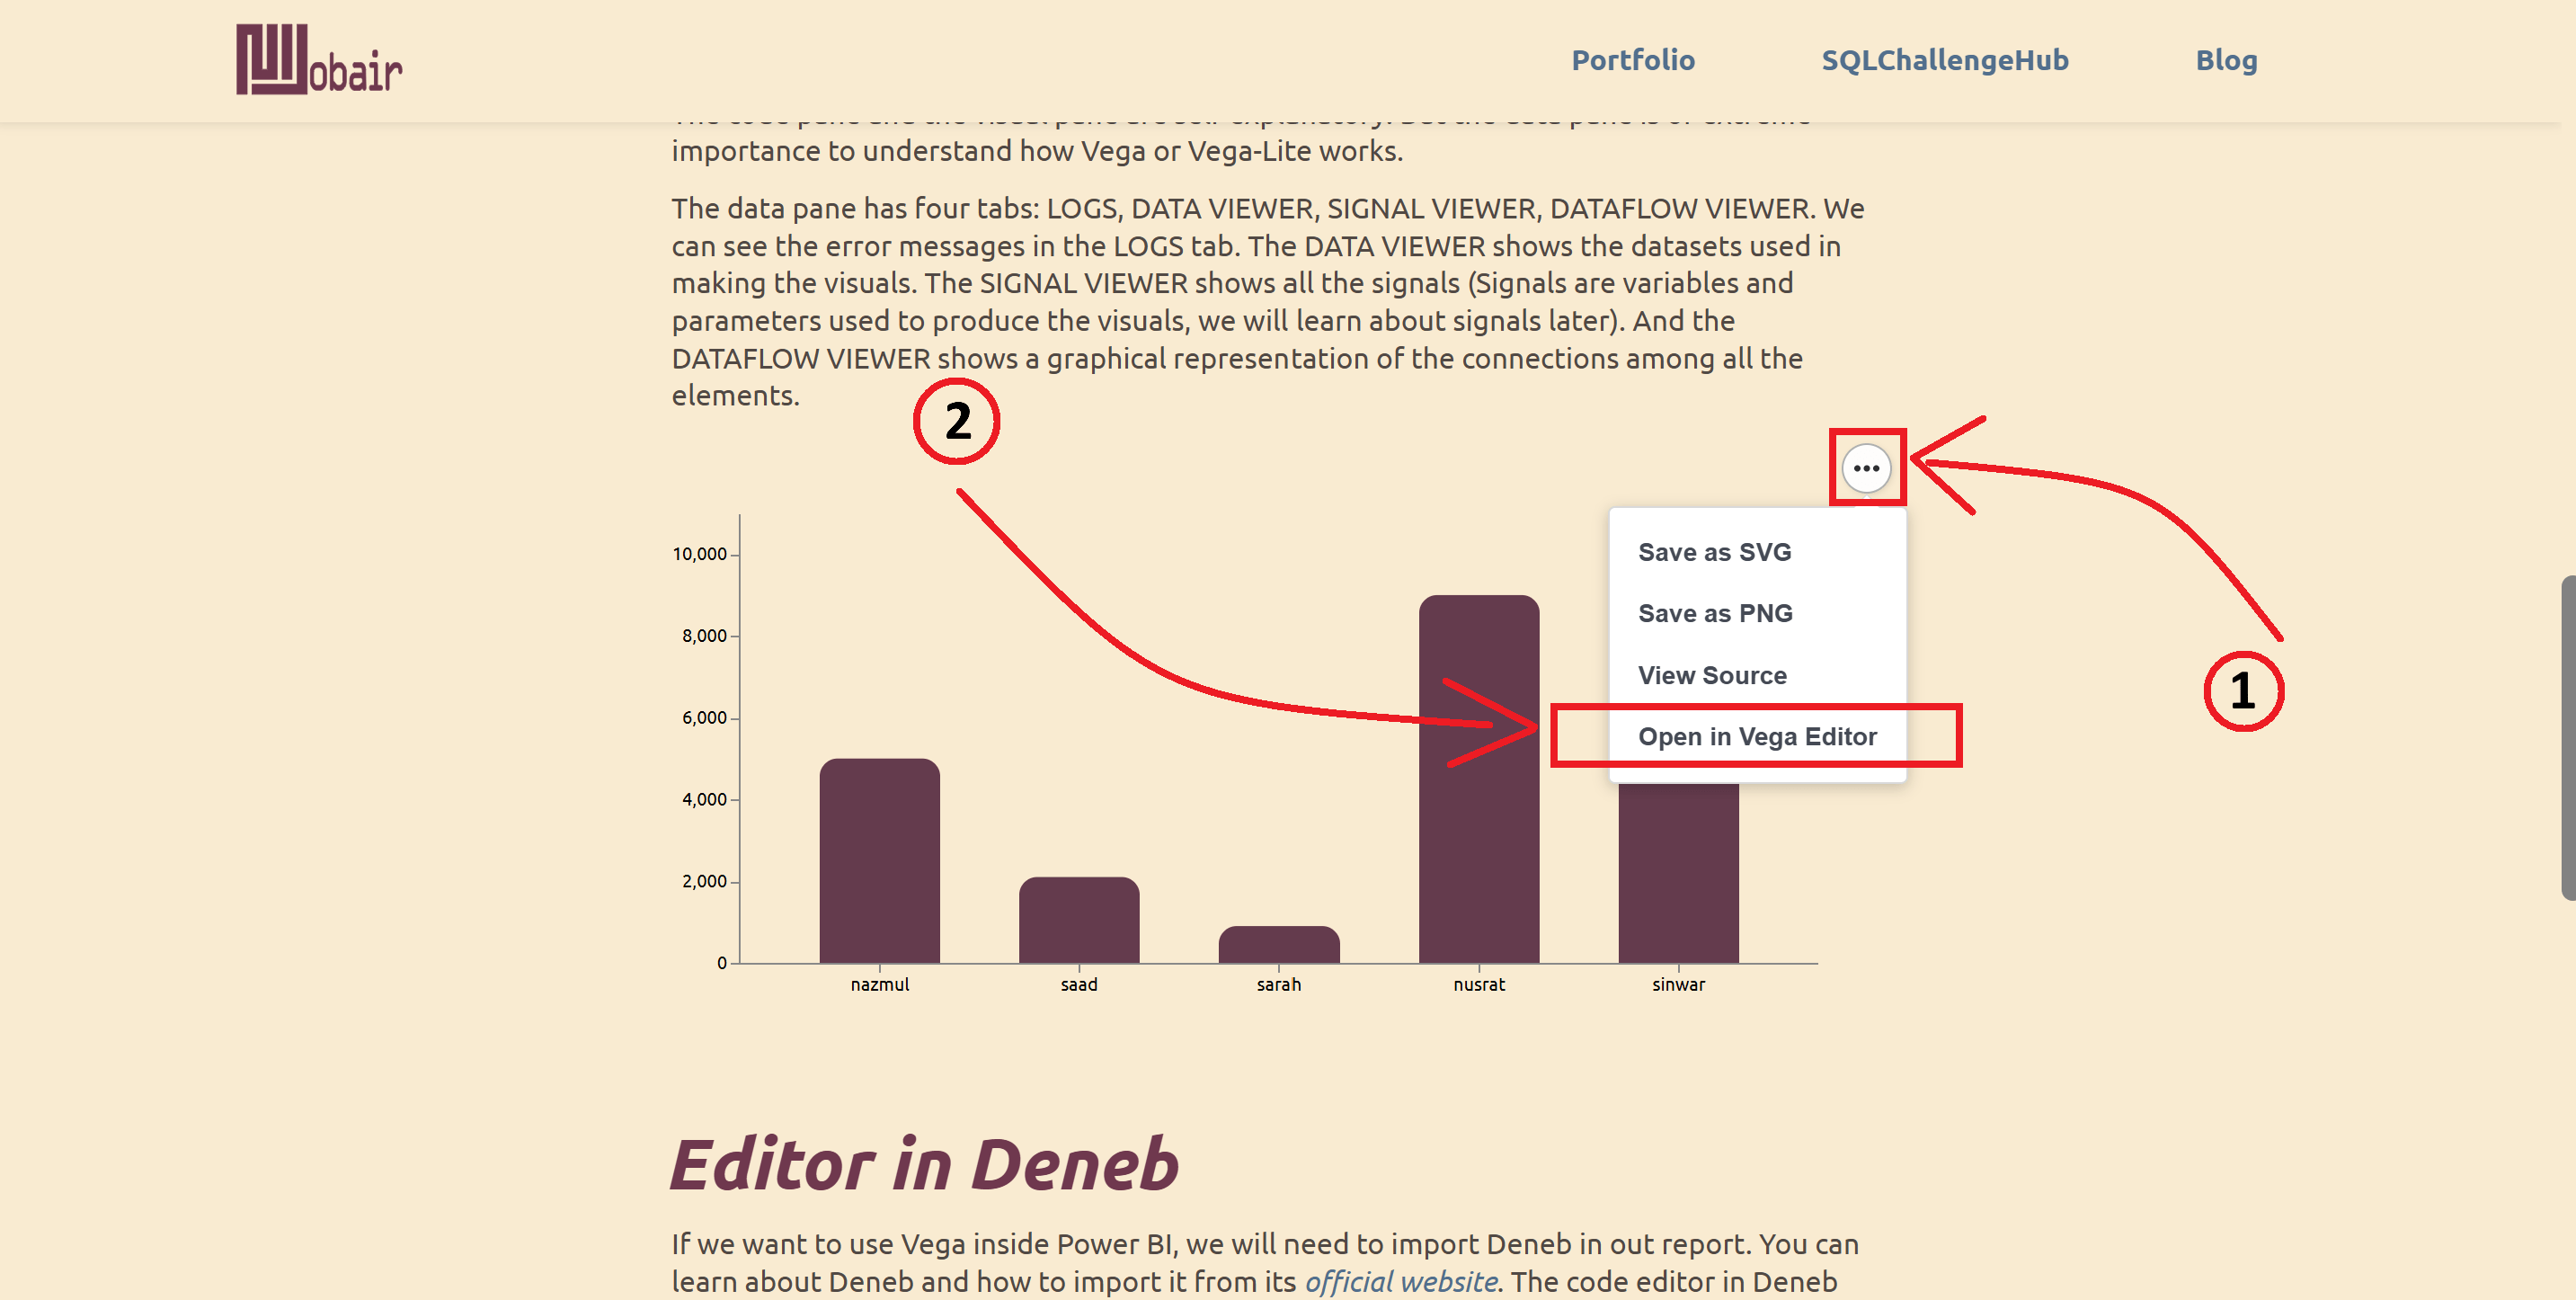
Try this out with the following chart:
Editor in Deneb
If you want to use Vega inside Power BI, you will need to import Deneb into your report. You can learn about Deneb and how to import it from its official website. The code editor in Deneb looks like this:
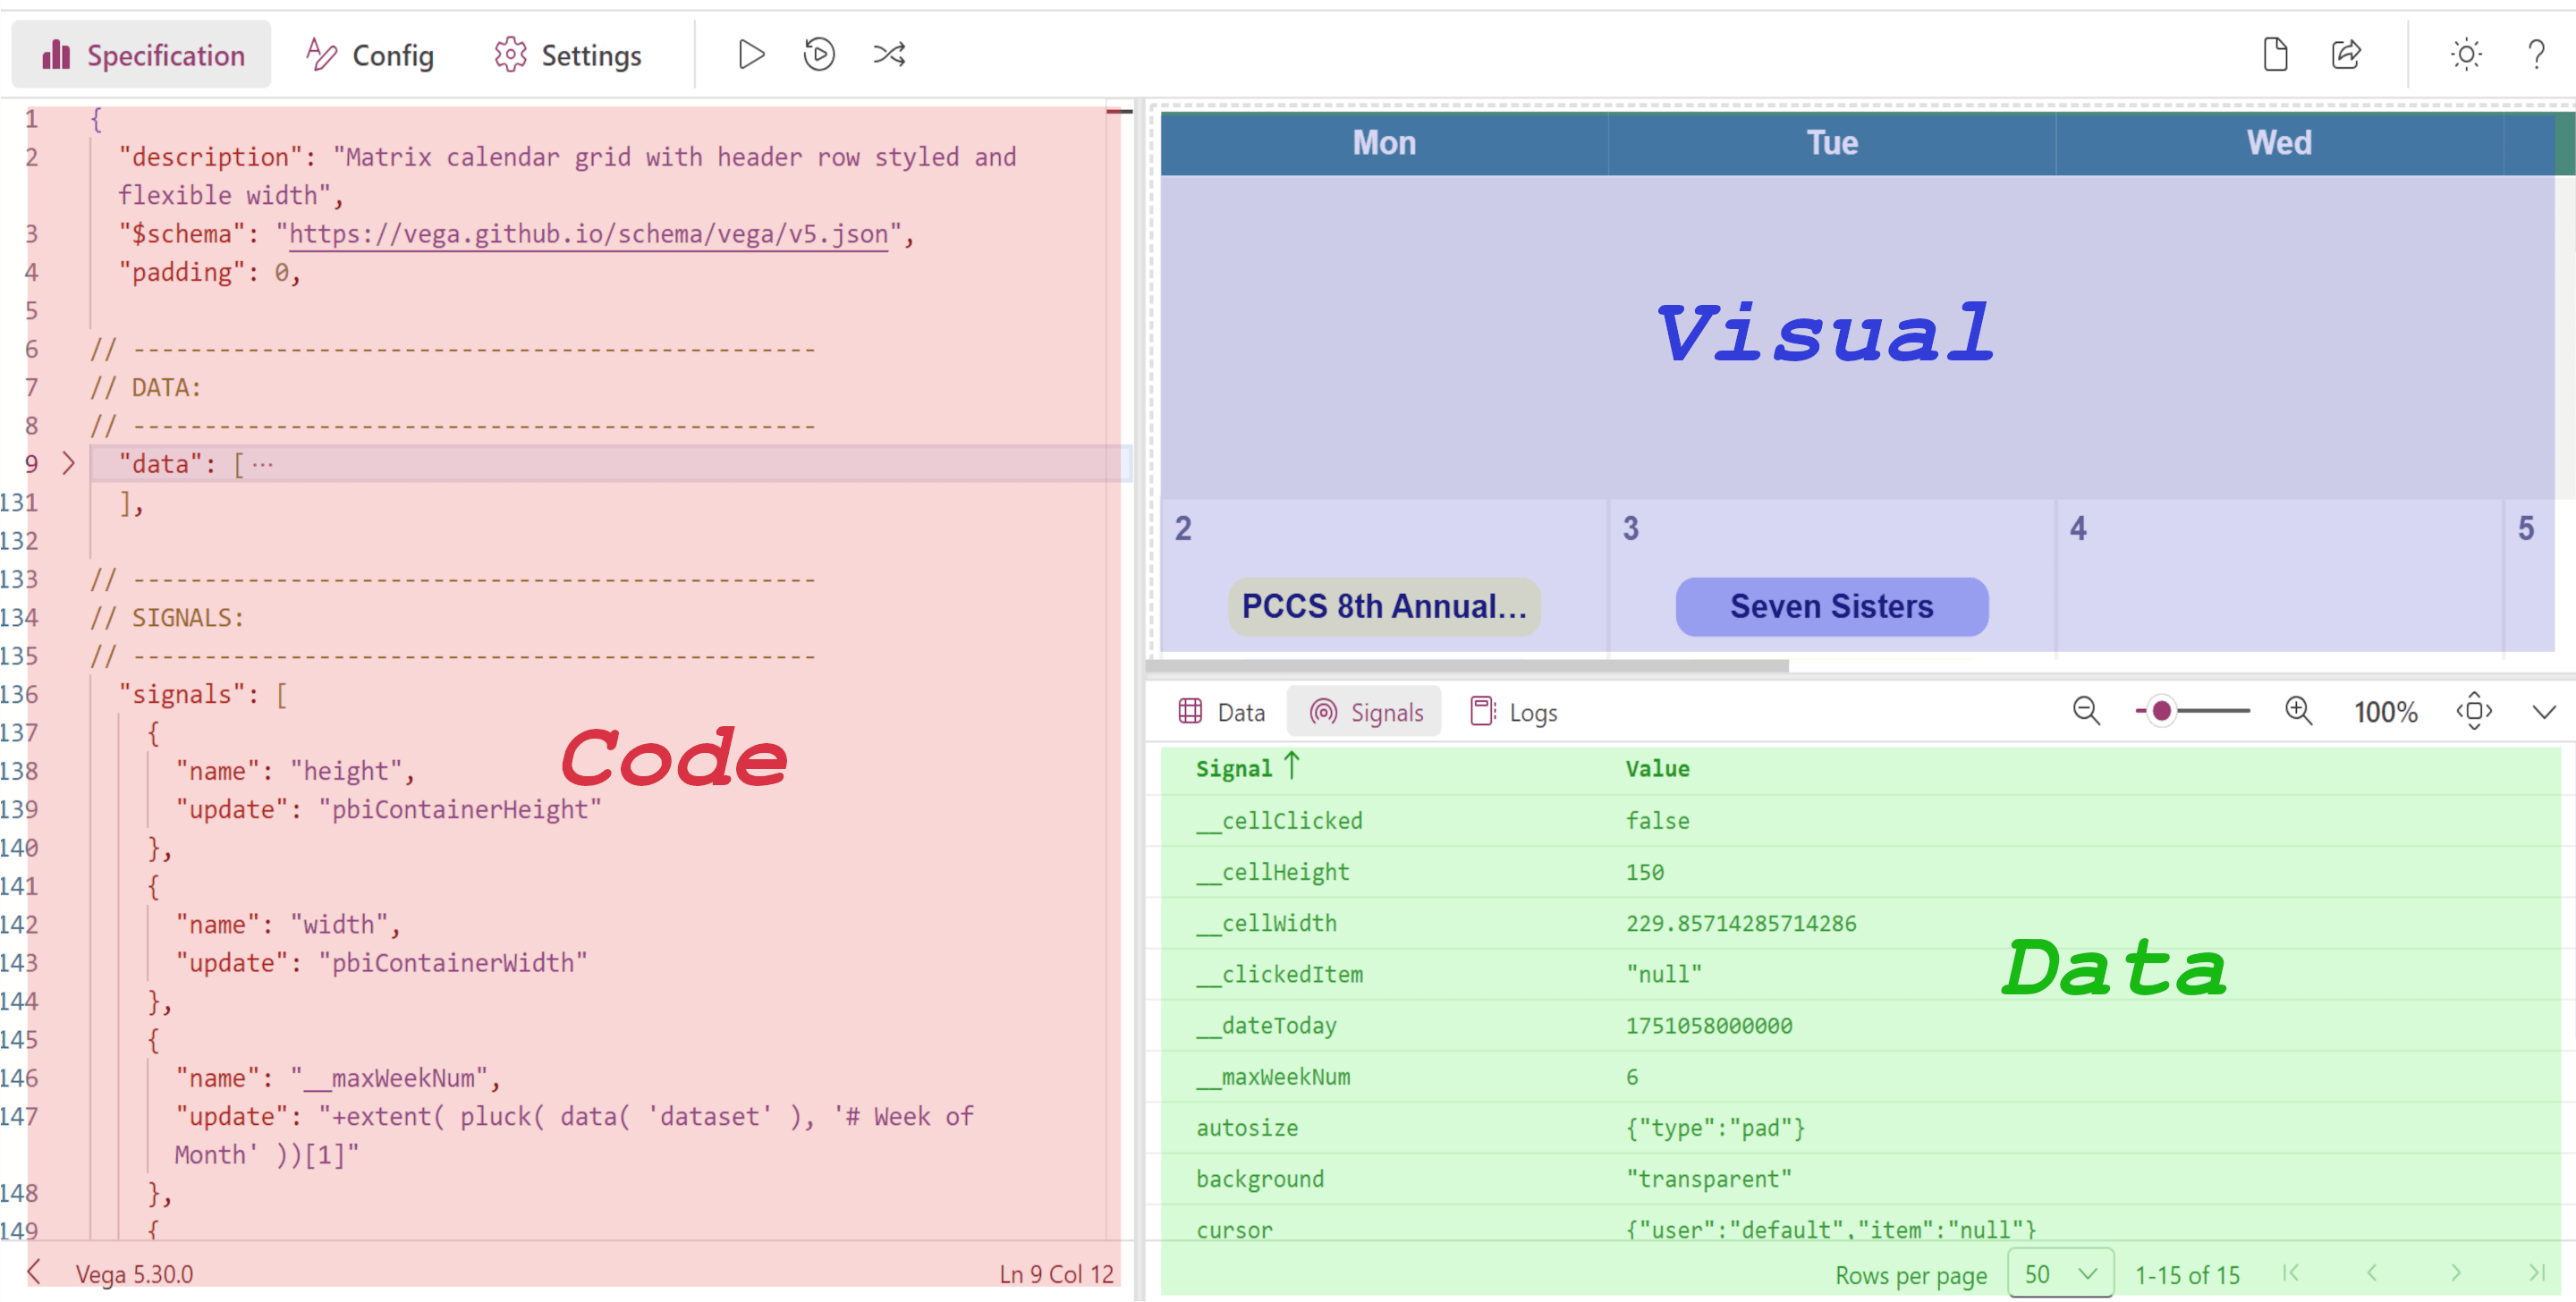
It is quite similar to the online editor. The only thing missing here is the DATAFLOW VIEWER. There are some other minor differences, which I will point out when necessary.
One nice thing about Deneb is that it integrates directly with your Power BI dataset. So instead of hardcoding data like we do in the online editor, we can work with dynamic data that’s already in your report.
For us, the most important pane is the Data pane. As we create more and more complex visuals and want to make our charts interactive, we need to make use of the Data pane quite frequently. It helps us verify what data is actually available to the visual and how it’s structured.
Explore the editors to get familiar with the different components. Don’t worry if some parts seem overwhelming at first—it will make sense as we go along. From the next post, we will start creating the visuals. Stay tuned!
