
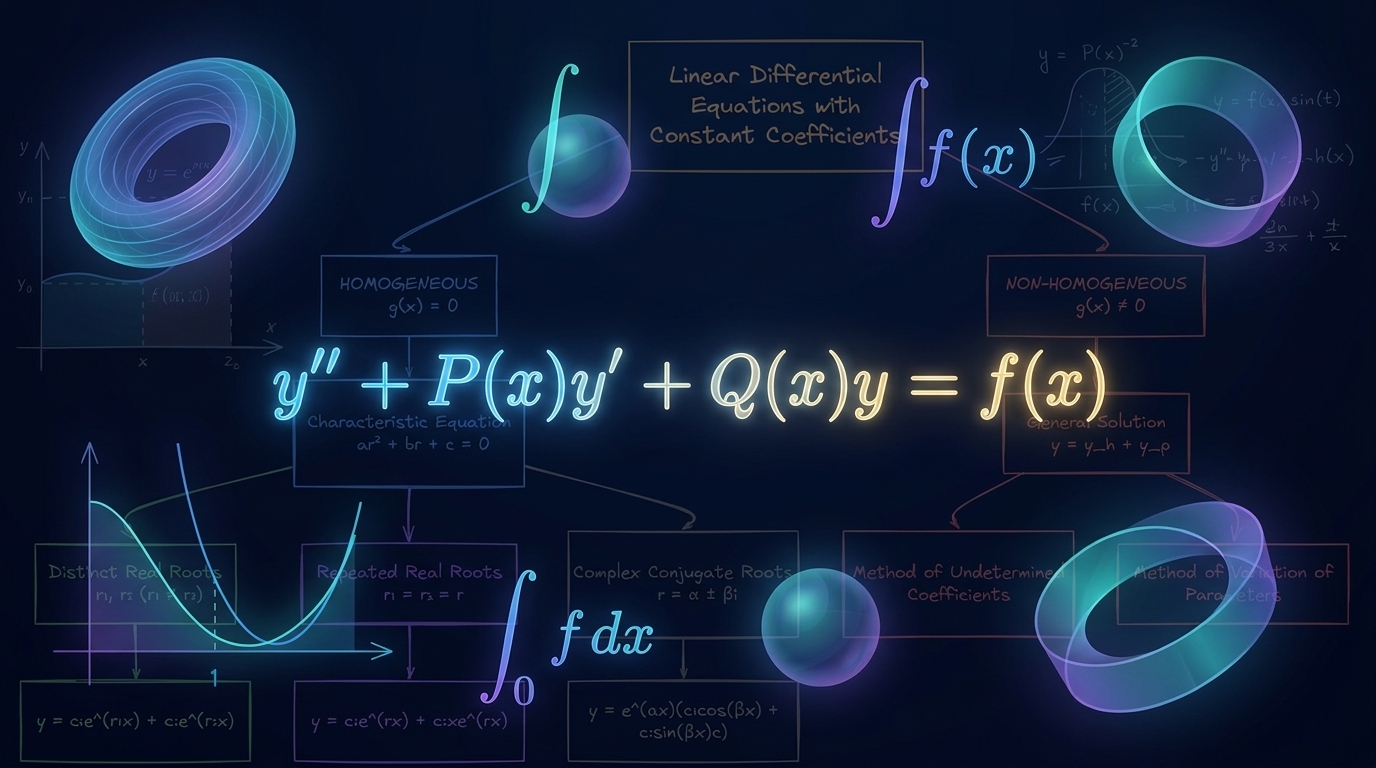
Differential Equations · Mindmap
Math
Differential Equations

Practical notes on data analytics, Power BI, Excel, SQL, Python, visualization, and the thinking behind better business decisions.
I write about things I learn while working with data — from technical techniques and analytical workflows to practical lessons in turning data into useful business insights.

Scales are the bridge between your data and the canvas. Learn what Vega scales are, why every chart needs them, and how to use different scale types with practical examples.
Transforming data is a key step in Vega before visualizing it. This post covers common transformations like calculated columns, filtering, aggregation, lookups, and sorting—so you can shape your data exactly the way you need.
To create any chart in Vega, you first need to bring in your data. This post covers the different ways to load and define datasets using the data block—both in standalone Vega and inside Power BI with Deneb.
Understanding Vega becomes much easier when you break it down into core components. This post introduces the essential building blocks—data, scales, and marks—that you need to get a chart on the canvas.
Before drawing anything in Vega, you need to understand the concept of the canvas. This post explains what the canvas is, how to make it visible, and why including a schema makes your life easier.
In this post, we explore the Vega code editors—both the online editor and the one built into Deneb for Power BI. Understanding these tools will help you test, debug, and build complex visuals more efficiently.
Some charts just aren't possible with Power BI's native visuals—but with Vega and Deneb, you can create stunning custom visuals like gradient area charts and radial plots. This post introduces Vega, the language behind Deneb, and lays the foundation for learning it step by step.
I tackled the 24 Days of SQL Advent Calendar this holiday season and I'm sharing my solutions and insights.
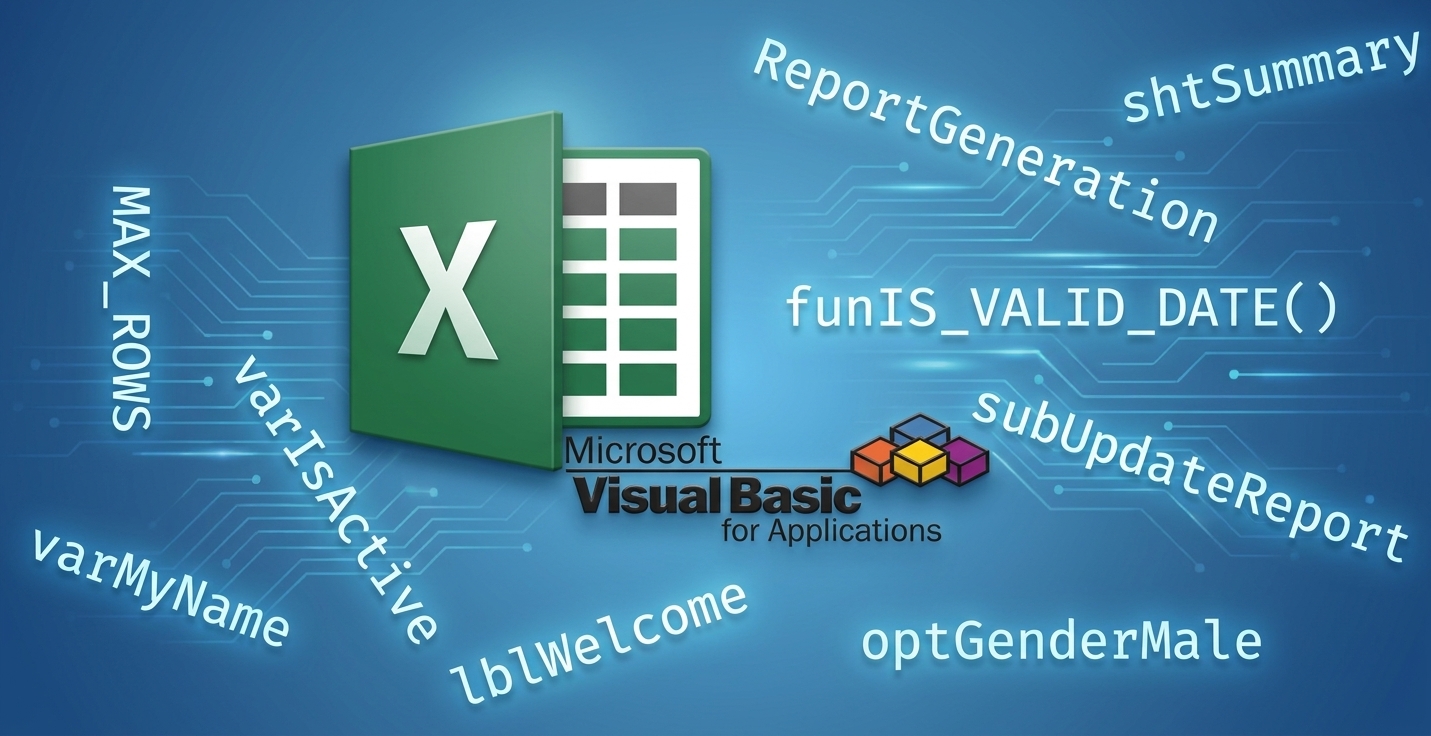
Learn the naming conventions I use in VBA to keep code clean, readable, and easy to maintain. Simple tips for variables, procedures, and more!
If you're interested in analytics, Power BI, Excel, SQL, or data visualization, feel free to get in touch.